ICICIGI on 30 September 2026: +5.0 % — the tape, as the panels read it
ICICIGI closed +5.0 %: +0.1 % at the open, +4.9 % traded. First read: large print, upward, 09:35 at 1,530.90; from there to the close: +3.9 %. Went the read's way.
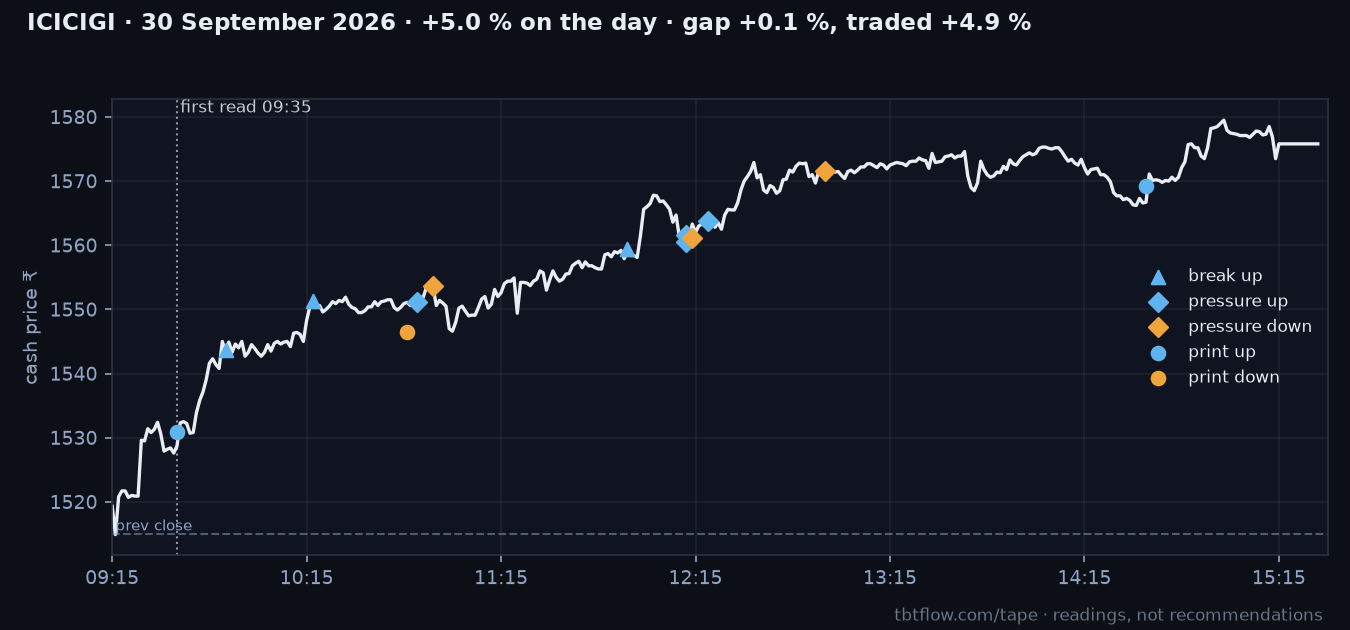
Cash price through the session with every panel read on it: ▲▼ level breaks, ◆ Pressure Zones, ● large prints (blue = upward read, amber = downward). The dotted line is the first read; the dashed line is the previous close.
The session, as the panels saw it
Cash tape: buyers led — net +₹19 cr on ₹294 cr traded; first hour +₹25 cr, last hour +₹1 cr.
Futures: sellers were the aggressor — net −₹11 cr on ₹203 cr; open interest +7.7 % from the open.
Level breaks flagged: 3 upward, 0 downward.
Pressure Zones: 10:49 ▲ Buy · At High → 10:54 ▼ Sell · Into Strength → 12:12 ▲ Buy · Cash only → 12:12 ▲ Buy · At High → 12:14 ▼ Sell · Into Strength (+2 more).
Large prints: 3 — ₹32 cr on the buy side, ₹3 cr on the sell side.
On the previous session's BTST list as bearish #13.
Readings, not recommendations. The list this stock sits on is the market's — the day's five biggest gainers and five biggest losers. All ten for 30 September 2026 →
The same panels, live, on every NSE F&O stock — breakouts, pressure, large prints, the futures book.
This page is the after-photo. The dashboard is the window during the session.
Read every panel behind these numbers, chapter by chapter.
Trading by the Numbers walks through the quantitative reads behind a modern F&O dashboard — order-flow imbalance, footprints, VWAP bands, OI flow, gamma structure and the expiry endgame — in plain trader-to-trader language.